Vibe-research is not vibes-based research.
When you submit an idea, here's exactly what happens. No black box. Every step is cited, every score is defended, every risk is named with what would change it.
One number. Four sub-scores. Zero hedge.
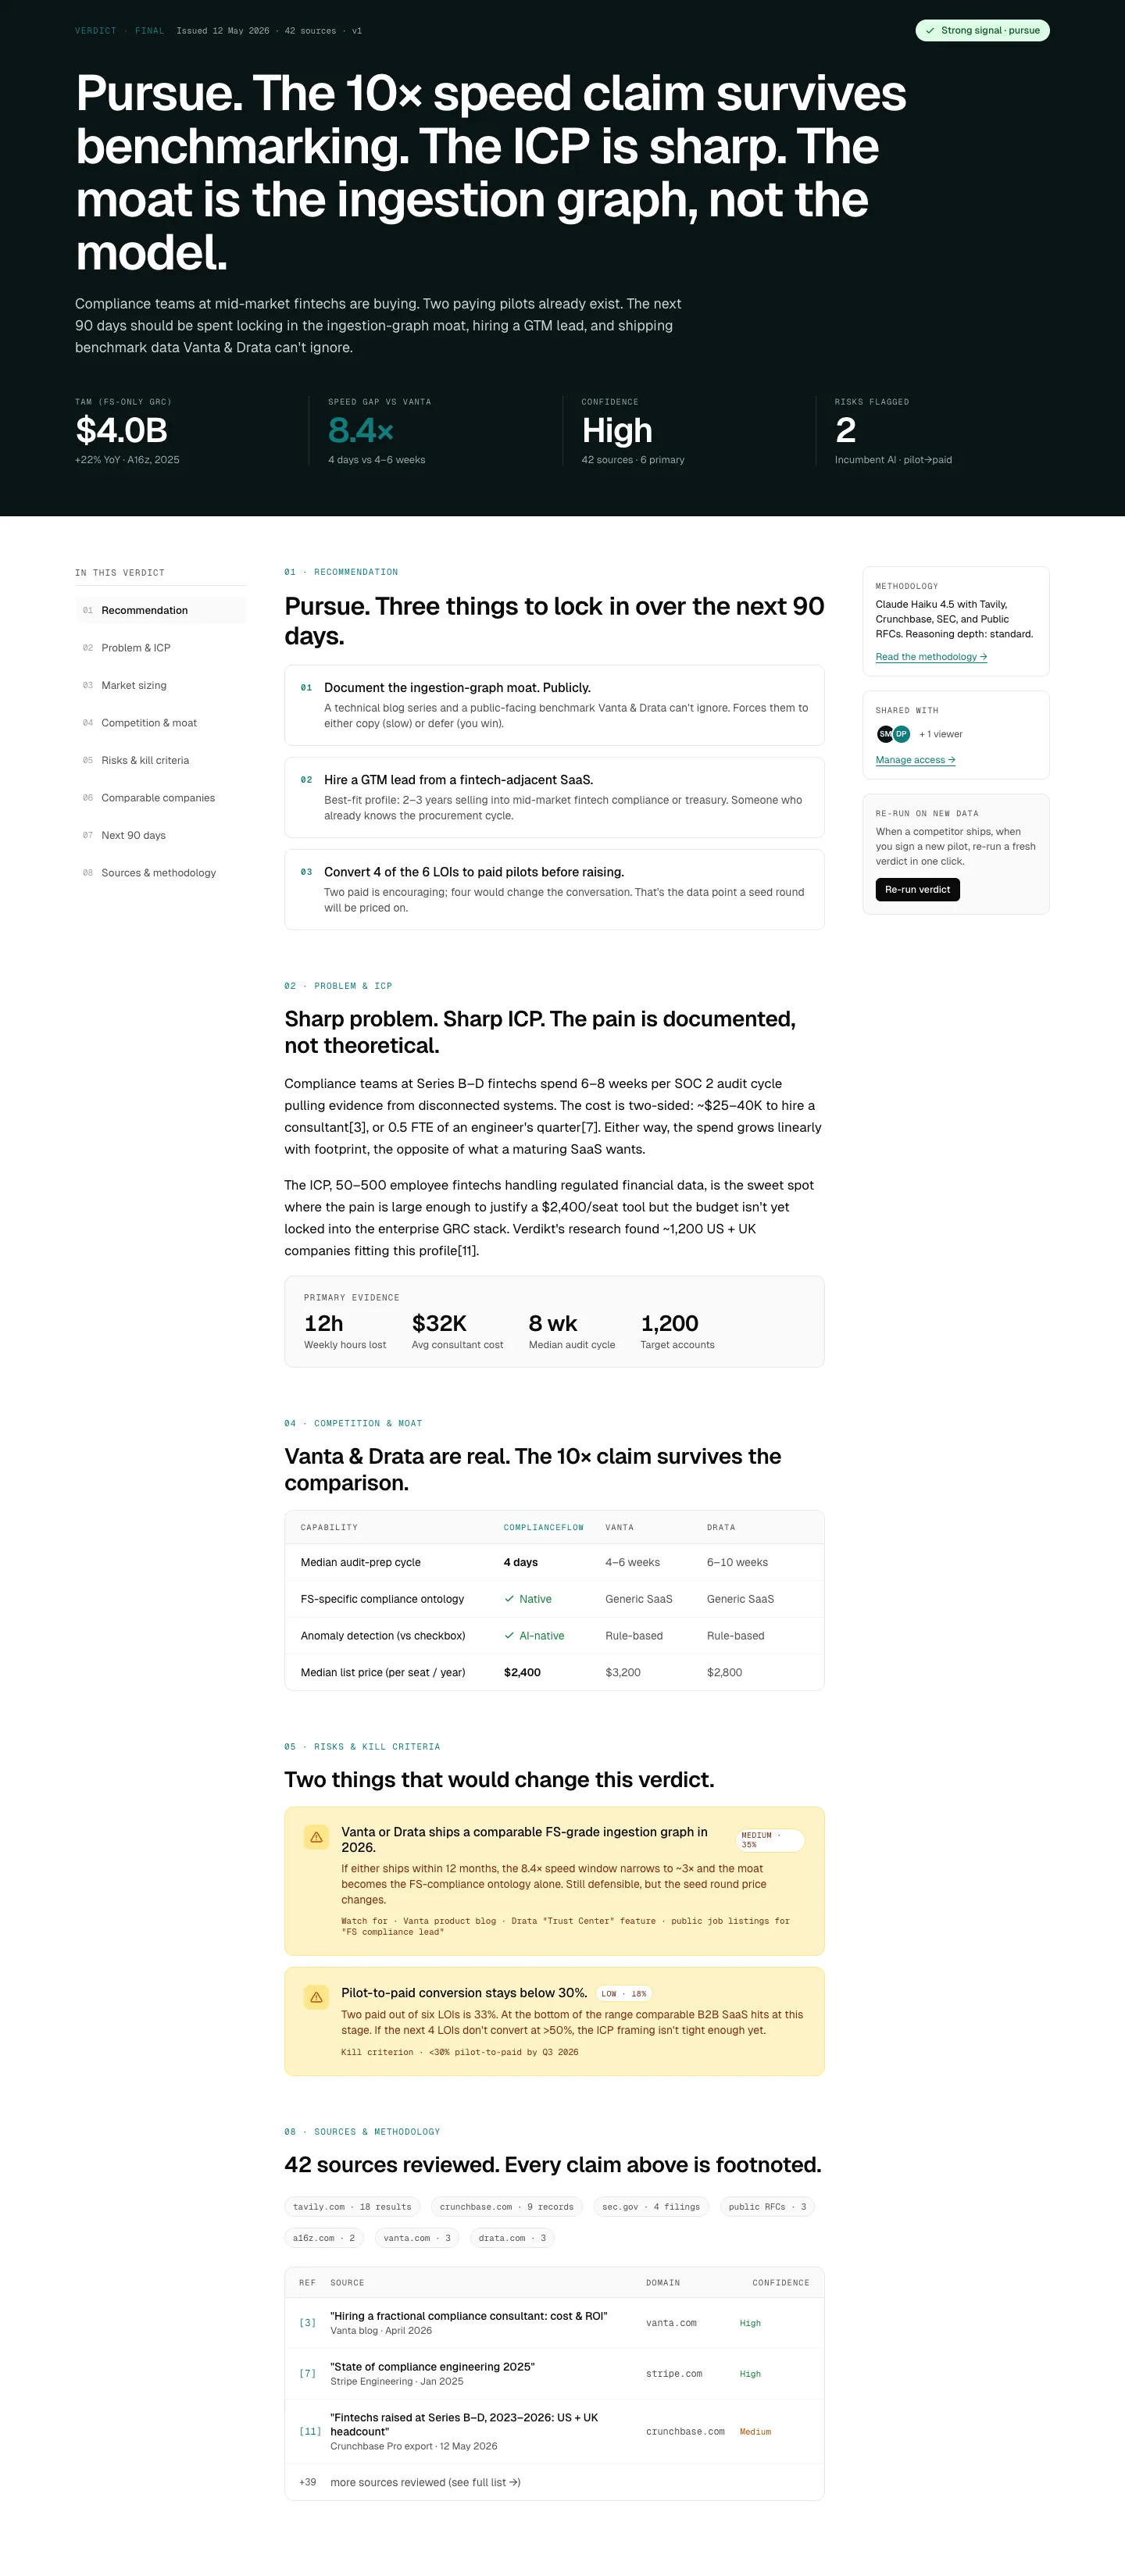
Every report ships with a Verdikt Score on a 0 to 100 scale. The score is the sum of four sub-scores (each 0 to 10) multiplied by 2.5. The number describes how the evidence stacks up. It does not tell you what to do.
How many real buyers exist for what you're charging. Bottom-up sizing only. Top-down numbers don't move this score.
Where you actually compete and against whom. Direct, substitute, and do-nothing baseline. The named substitute is the one that matters.
Whether people are already trying to solve this. Signal from search, forums, reviews, hiring posts. Not vibes, traffic.
Whether a vibe coder can actually ship this. Tooling, dependencies, and the build outline that follows from the report.
Score 70 or higher and the report includes a build outline, stack options, and launch-channel notes. Below 70, the report names exactly what would have to change for the score to pass the bar.
Five stages. The first is with you. The next four run automatically.
Intake and framing
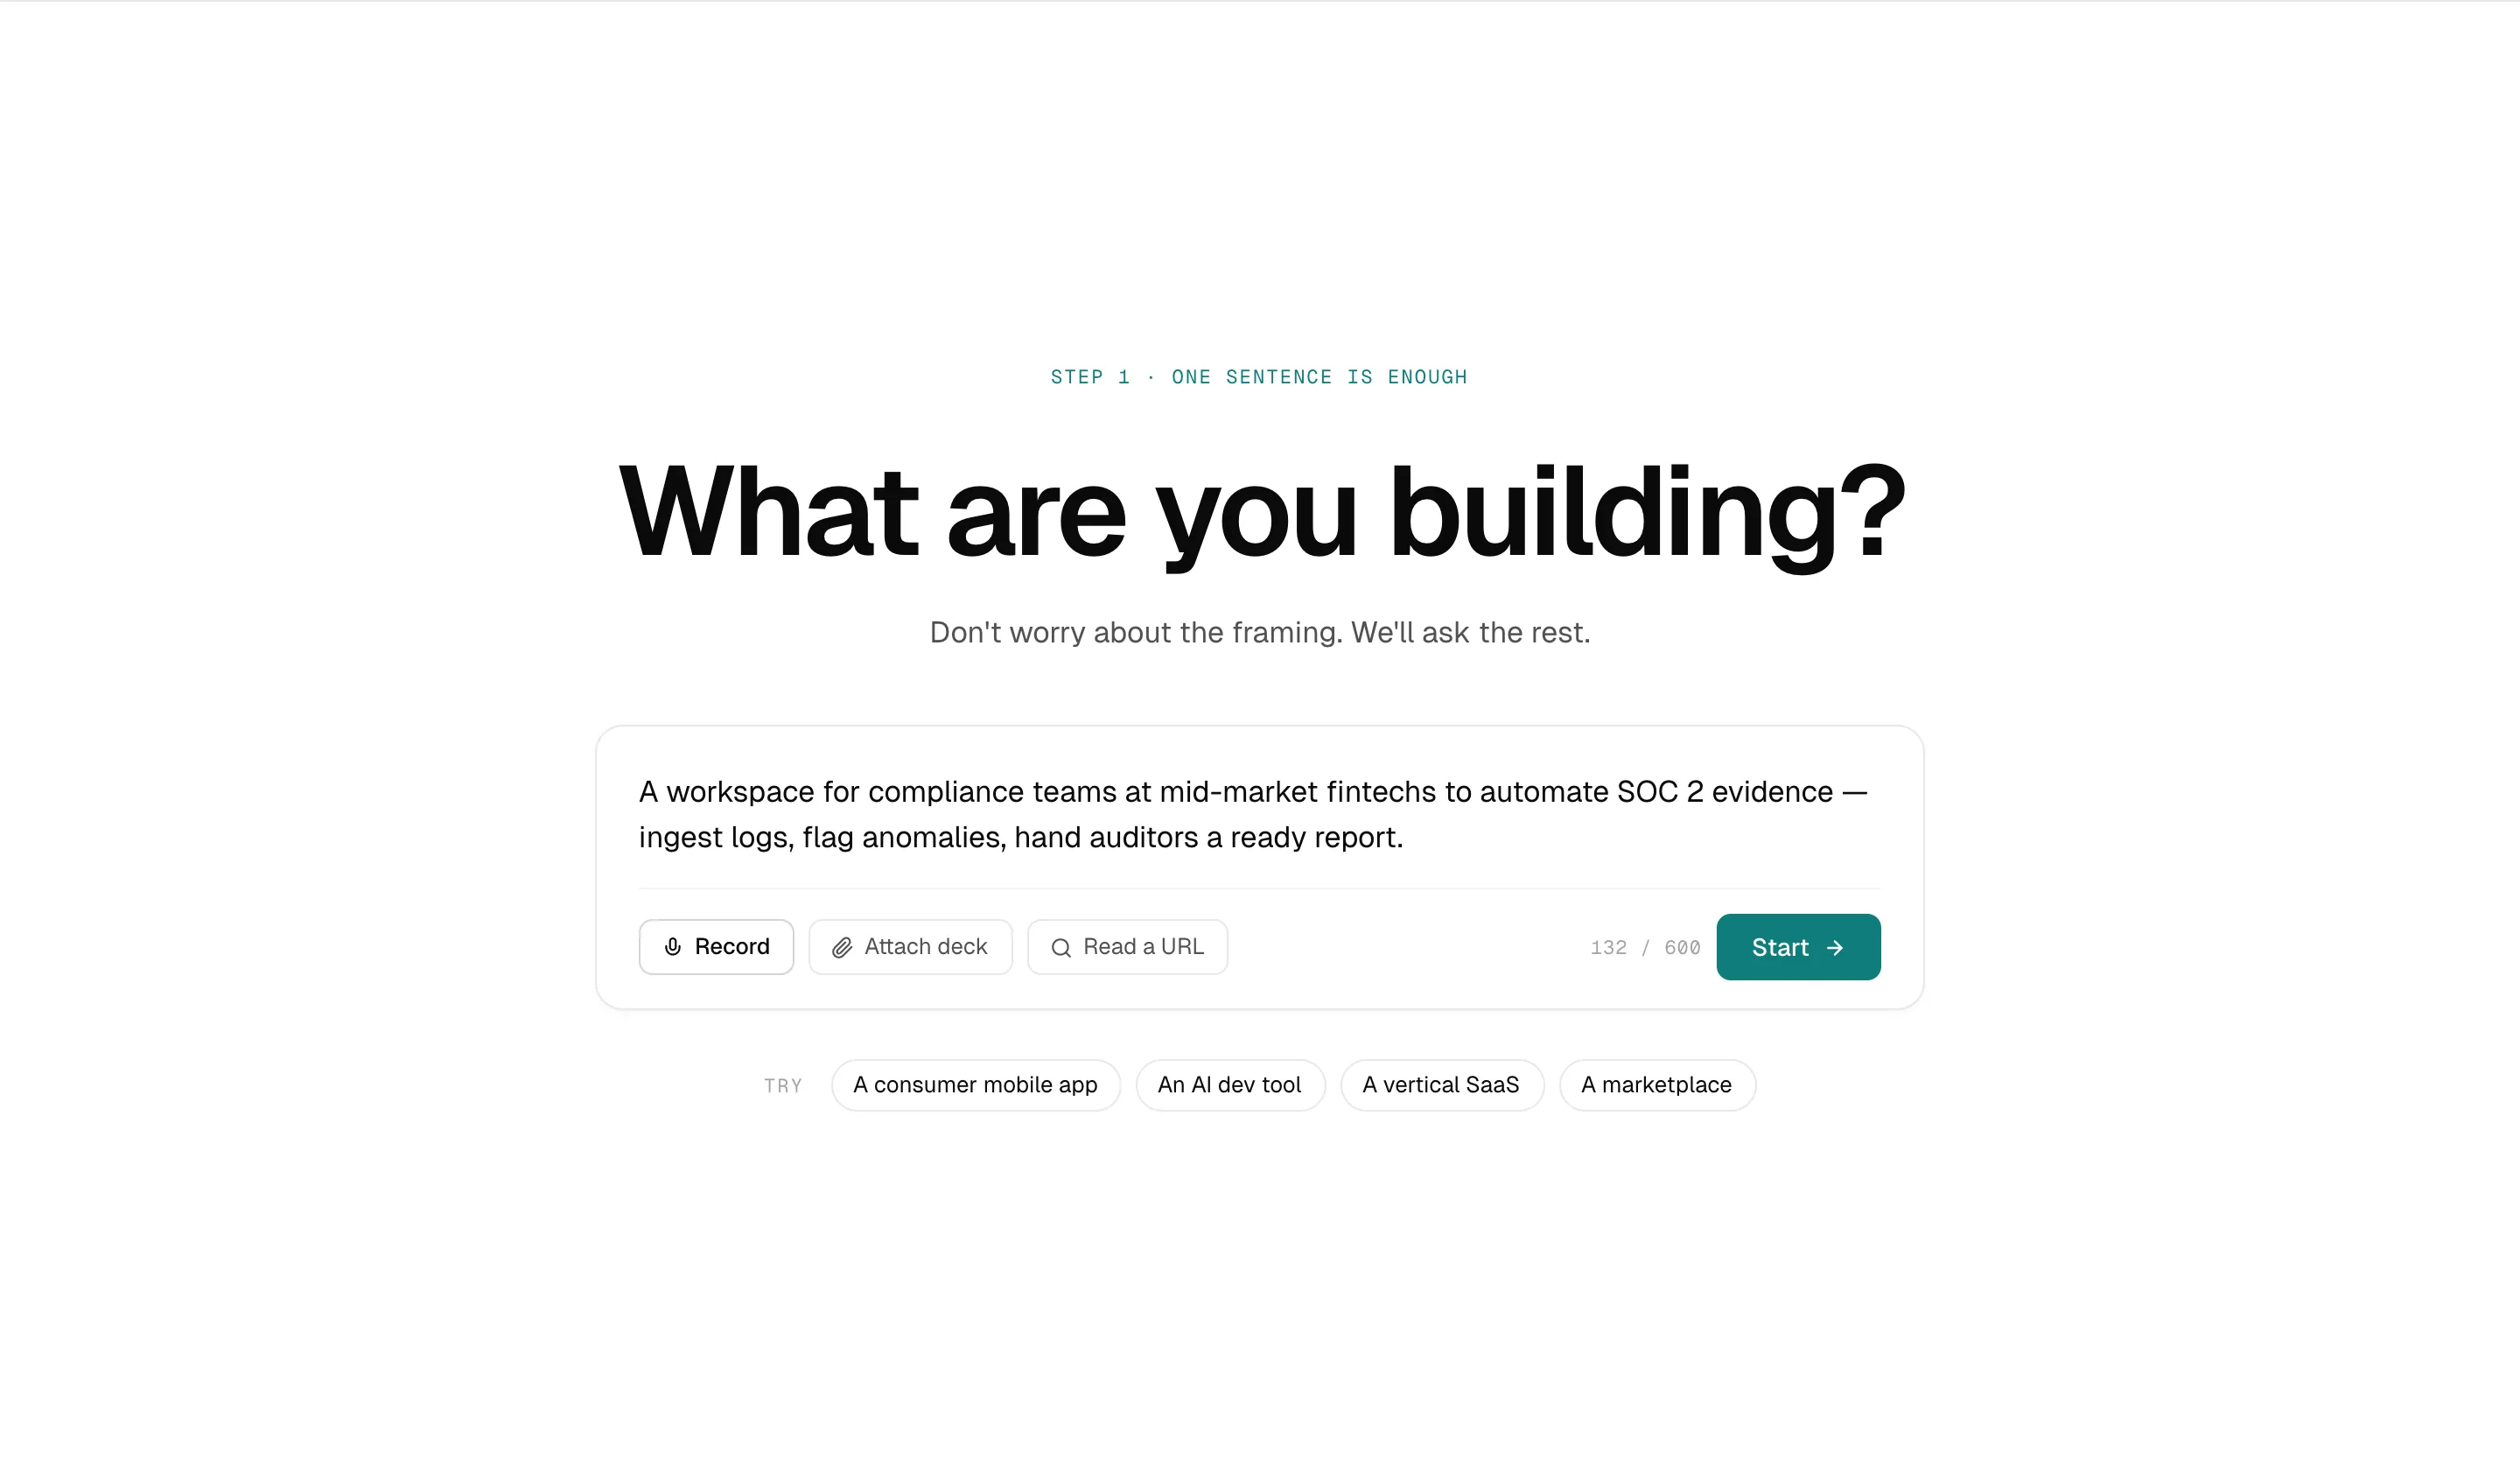
You tell us what you're building in one sentence. We turn it into a structured brief: who you're building for, what you'd charge, what could kill the idea. The questions are short. The answers shape every stage that follows.
- · One-sentence pitch
- · Who you think pays
- · Price you'd charge
- · What scares you
- · Structured brief
- · Hypothesis tree
- · Coverage map
- 01Your pitch is parsed into a hypothesis tree. One main claim, three to five claims under it, each one tied to evidence the pipeline has to find.
- 02Every claim gets tagged with what would have to be true for it to hold, and what tier of source can prove it.
- 03We map which sources, datasets, and competitor surfaces each claim needs before the pipeline starts running.
Market sizing
We figure out how many people would actually pay you, today. No top-down 'the market is $10B' math. We count real customers in real segments and build the number from the bottom up.
- · Who pays
- · What they'd pay
- · Geography
- · Comparable wedges
- · Market sizing table you can defend
- · Sizing memo
- · Growth rate range
- · Willingness-to-pay signals
- 01Bottom-up TAM built from public data: government statistical databases, regulatory filings, primary registries. No top-down analyst numbers as the load-bearing input.
- 02SAM is derived from how dense your ICP actually is, cross-checked against three comparable wedges that already shipped.
- 03SOM is modeled across three launch-channel motions (founder-led, PLG, channel) with named penetration ceilings.
- 04Growth rate is triangulated from at least two independent sources. When they conflict, both are shown. We do not silently average them.
Competitive map
We map who else is building this. Direct competitors (the products that look like yours), substitutes (the tool people use today instead), and the do-nothing baseline (people who just live with the problem). Each one gets scored so you know where you'd actually compete.
- · Category definition
- · User workflows
- · Your wedge
- · Substitute guesses
- · Competitor scorecard
- · The named substitute
- · Moat thesis
- · Threat ranking
- 01Direct competitor sweep across funding databases, review sites, launch boards, and recent shipping cadence.
- 02Substitute mapping: open source, in-house build, spreadsheets, services firms, and the do-nothing baseline.
- 03Each player is scored on feature parity, distribution reach, capital position, hiring velocity, integration surface, and switching cost.
- 04Your moat thesis is tested against the strongest competitor's last 90 days of shipping. Slow shipping is a different signal than fast shipping.
10× claim test
You probably claim your idea is 10× better at something. We stress-test it. We try to break the claim with the strongest counter-argument we can find. If the claim survives, your Verdikt Score goes up. If it doesn't, we tell you why.
- · Your 10× claim
- · What would prove it wrong
- · Benchmark targets
- · Comparable products
- · 10× audit
- · Benchmark grid
- · Falsifier check
- · Adversarial transcript
- 01Your claim is broken into measurable sub-claims: latency, cost, accuracy, coverage, time-to-value.
- 02Each sub-claim is benchmarked against the named competitor and the do-nothing baseline.
- 03Your falsifier is run as an inverse test. If the thing that would break the claim is already true today, the claim is downgraded.
- 04Adversarial pass: a second pass tries to break the claim from the strongest counter-argument it can find. The transcript ships with the report.
Synthesis and Verdikt Score
We synthesize everything into your Verdikt Score and four sub-scores. We name the top three risks. If your score is 70 or higher, the report includes a build outline with milestones and launch-channel notes. If it's below 70, the report names exactly what would have to change for it to pass the bar.
- · All prior stage outputs
- · Reasoning traces
- · Citation pack
- · Quality gate results
- · Verdikt Score and four sub-scores
- · Top three named risks
- · Build outline (if score is 70 or higher)
- · Citation pack
- · Reasoning trace
- · Run record
- 01Report is drafted to a fixed template. Deviations from the template require an explicit override and are flagged in the metadata.
- 02Output is a numerical Verdikt Score on a 0 to 100 scale, plus four sub-scores: Market, Competition, Demand, Stack Fit. Each sub-score is 0 to 10. The Verdikt Score is the sum times 2.5.
- 03The top three named risks are restated with the evidence threshold that would trigger them.
- 04Fourteen quality gates run on the draft. Any failure blocks ship and sends the draft back to the relevant stage.
- 05A run record is emitted with the report: generation timestamp, pipeline version, gate results, and re-run hooks for the three weakest claims.
Every report has a cover, eleven sections, and a run record.
The deliverable is a multi-section research report, not a paragraph. The cover shows your Verdikt Score, the four sub-scores, and the top three named risks. The rest is the receipts.
One screen. Your score, the four sub-scores that make it up, and the top three risks the report found. Cited evidence and the build outline are inside.
Sections 09 and 10 ship only when your Verdikt Score is 70 or higher. Every claim across all sections is cited and the source URL is traceable.
Where we go to pull the receipts.
A claim from a government database and a claim from Reddit are not the same claim. The numbers your idea hinges on come from Tier 1 sources like the U.S. Census Bureau and World Bank Open Data. Tier 2 is context. Tier 3 is reading the room.
We pull from 180 named sources below. A typical report cites about 40 of them, chosen for relevance to your idea and weighted by tier. Every cited source is one the research agents actually retrieved during your run — the citation library is built from that retrieved set, not synthesized.
Government statistical databases, regulatory filings, patent offices, peer-reviewed research. This is where your sizing numbers come from.
Established tech and business publications, industry newsletters, sector-specific outlets. Context and corroboration.
G2, Hacker News, Reddit, Product Hunt, indie hacker forums, Discord. Where your users actually hang out. Used for sentiment, never as fact.
A research letter for AI builders.
One letter per month. What we're shipping, what we're learning, what's actually working in the field.
Fourteen checks. Any failure blocks ship.
Fourteen automated gates run on every draft. A failure returns the draft to the relevant stage with the flagged claim. The report you get is the one that passed all fourteen.
Every Verdikt Score names what would change it.
If your top competitor ships your wedge in six months, your score drops. We name that threshold explicitly in the report. The point: the score is a finding, not a verdict. The threshold tells you what reality has to look like for the finding to flip.
You stake it. The pipeline can't test what you haven't named.
Run as an inverse claim. If it already holds today, the score is downgraded.
Reproduced in the report with the threshold that would trigger a re-run.
What Verdikt refuses to do.
A methodology is defined by what it rejects. Six things the pipeline will not do.
We don't quote you a $10B TAM with a 0.1% capture rate. That math sells slide decks, not products. We build bottom-up from real segments.
No claim rests on one source. If two Tier 1 sources don't both back a number, the claim drops to NEEDS MORE EVIDENCE.
If two real sources disagree, we show both. We don't quietly average them and pretend the gap doesn't exist.
We don't tell you that you have 'strong network effects' unless a real metric is trending the right way. Otherwise the moat is marked speculative.
No 'it depends.' You get a number. The number describes the evidence, not what you should do with it.
Your brief, trace, and report never train any model. LLM provider payloads run under zero-data-retention terms, and submitted briefs are deleted from Verdikt storage after 30 days.
Run your idea through it.
$14.99 for the full report. Refund or re-run if we fail to deliver a verdict.
Refund or re-run for documented report errors.Verdikt is a research and validation tool for product decisions. It is not investment, financial, career, or legal advice. The Verdikt Score is a numerical research finding, not a recommendation to act.